Why Your Monthly Water Bill Is Rising Faster Than Inflation
By late 2024, the white “bathtub ring” around Lake Mead—a bleached collar of mineral deposits marking the decline of the Colorado River—has evolved from a regional drought indicator into a primary metric for American economic risk.
Lake Mead and Lake Powell, the nation’s two largest reservoirs, reached multi-decade lows in 2024, hovering at roughly 33 percent and 24 percent capacity, respectively. For the 40 million people and the vast agricultural belts of the Southwest that rely on the Colorado River, these figures represent a structural change in the cost of resource management. According to Arizona State University’s Kyl Center for Water Policy, the 2026 deadline for states to negotiate new operating guidelines for the river is the next critical junction for regional stability.
American households are increasingly seeing the impact of these shortages on their monthly utility bills. The era of nearly free, invisible water is transitioning into a period of intensive infrastructure pricing. Data from Bluefield Research shows that U.S. household water and sewer bills reached a five-year high by 2025, rising 5.1 percent. This increase significantly outpaced the general rate of consumer inflation, a trend that accelerated through the mid-2020s.
The Kitchen Table Cost of Modernization
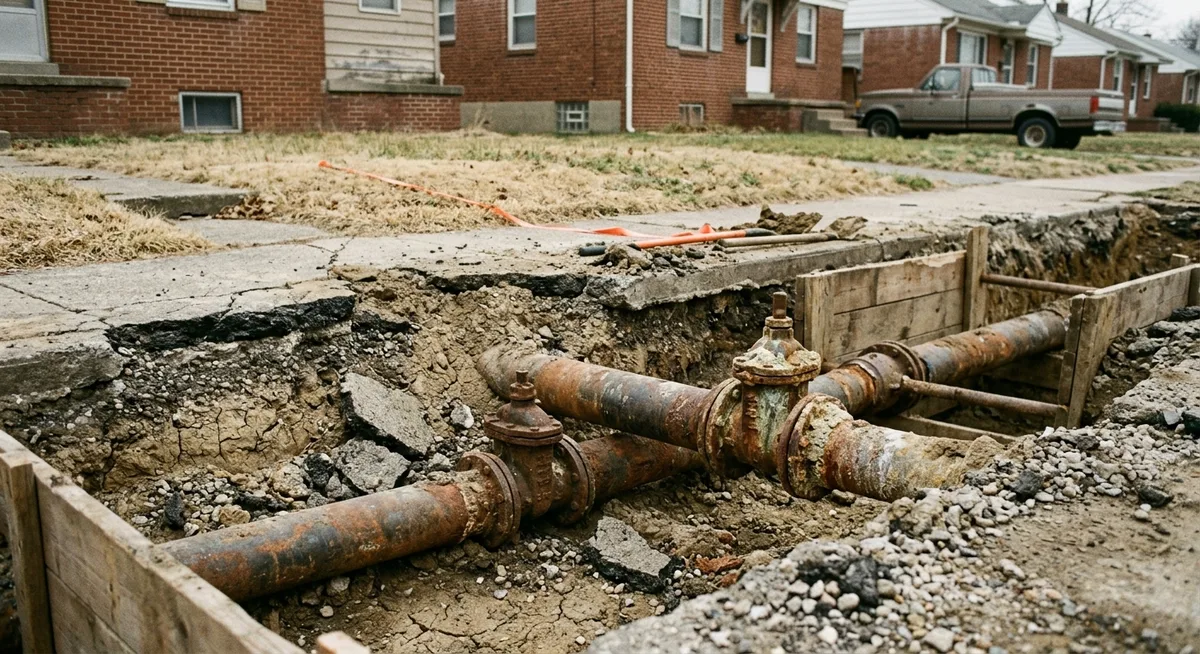
For a typical household in a water-stressed municipality, the cost of service is no longer a minor budgetary consideration. By early 2025, the five-year cumulative increase for U.S. municipal water and sewer rates reached 24.2 percent. This shift is driven less by immediate scarcity than by the deferred maintenance of the nation’s aging plumbing.
Utilities across the country are managing the twin pressures of climate-driven supply shortages and the mandate to modernize 19th-century infrastructure. In early 2024, U.S. utilities filed approximately $9.4 billion in rate increase requests, affecting more than 81 million customers. According to analysts at Bluefield Research, utilities are facing internal inflationary pressures that increase the cost of maintaining and modernizing outdated delivery systems.
The impact of these rising costs is regressive. Analysis from the U.S. Census Bureau and the Bank of America Institute indicates that approximately 26 percent of lower-income U.S. households reported a shortage of drinkable water within one month of a natural disaster. As rates rise, the “water gap” between households able to afford high-efficiency home systems and those who cannot is becoming a significant factor in residential economic inequality.
Source: Bluefield Research / PowerLines Report, March 2026
The High-Tech Thirst
While residential costs rise, a competitive race for water is unfolding in the industrial sector. The semiconductor industry, a pillar of national strategic interest, requires significant water volumes to function. A single semiconductor fabrication plant, or “fab,” can require up to 10 million gallons of ultrapure water per day—roughly equivalent to the daily usage of 33,000 households.
This requirement creates tension in regions like Arizona, where the expansion of domestic chip manufacturing coincides with a shrinking river supply. Between 2021 and 2024, global investment in these fabs averaged $147 billion annually. A significant portion of this capital was directed toward water-stressed regions, predicated on the assumption that reclamation technology can mitigate hydrological risks.
In June 2023, the Arizona Department of Water Resources restricted new housing construction in the Phoenix area that relies solely on groundwater, citing a lack of guaranteed supply over the next 100 years. This decision highlighted the trade-offs local governments must navigate between industrial growth and residential expansion when resources are finite. Data from the Potsdam Institute for Climate Impact Research suggests the global hydrological cycle is under unprecedented stress, creating a new set of constraints for industrial planning.
A Systemic Risk for Global Finance
Water scarcity is being reclassified from an environmental concern to a systemic financial risk. The International Monetary Fund (IMF) estimated in late 2024 that the annual economic value of water and freshwater ecosystems is approximately $58 trillion—roughly 60 percent of global GDP. Despite this value, the IMF notes the resource remains critically underpriced in most global markets.
In Europe, the European Central Bank (ECB) has begun assessing water scarcity as a direct threat to the stability of the banking system. More than €1.3 trillion in corporate loans within the European Union are currently held by sectors with high water-scarcity exposure.
According to 2024 projections from the ECB and Bruegel, a one-in-25-year extreme drought in the EU could put nearly 15 percent of the region’s total economic output at risk. This has reframed water as a “force multiplier” for financial risk, impacting not only agricultural output but the solvency of financial institutions with exposure to water-dependent supply chains.
Source: UN World Water Development Report 2024
The Human and Real Estate Cost
In the American West, the most tangible sign of the crisis is often found in the stability of the land itself. In California’s Central Valley, intensive groundwater pumping has led to land subsidence, causing the ground to sink.
A 2025 study from UC Riverside found that this subsidence has resulted in an aggregate loss of $1.87 billion in housing value across the valley. Individual home sale values in affected areas dropped by between $6,689 and $16,165 on average. As the water table recedes, the associated real estate equity often declines with it.
Research from the University of California, Davis, indicates that the economic costs of failing to address these supply issues are substantial. Analysts suggest that without intervention, California could face the fallowing of 3 million acres of farmland and the loss of 67,000 jobs.
This labor volatility is more pronounced in developing economies. In low-income nations, 80 percent of all jobs are water-dependent, largely due to the dominance of the agricultural sector. In contrast, high-income, diversified economies see about 50 percent of their workforce tied to water. This means a water-related shock can hit lower-income nations with significantly more labor force volatility than it does the United States or Germany.
Long-Term Economic Projections
The Global Commission on the Economics of Water reported in late 2024 that over half of global food production will be at risk by 2050 due to the destabilization of the water cycle.
By the middle of the century, the global water crisis is projected to cause an average loss of 8 percent of GDP worldwide. In low-income countries, that figure could reach 15 percent. In the Middle East and North Africa (MENA), the UN World Water Development Report projects that 100 percent of the population will live under “extremely high” water stress by 2050, meaning they will be utilizing 80 percent or more of their available supply.
Source: Global Commission on the Economics of Water, 2024
World Bank analysis suggests that some regions could see growth rates decline by 6 percent of GDP due to water-related impacts on health, agriculture, and incomes.
Efficiency as a Growth Driver
The current crisis is accelerating a shift toward water-efficient technologies as a driver of economic growth. In China, research indicates that a 1 percent improvement in water technology progress can drive approximately 0.142 percent of national GDP growth.
There is significant potential for economic gain through basic infrastructure maintenance. The World Economic Forum reported in 2023 that the world loses 346 million cubic meters of water every day to leaks before it ever reaches a consumer. This “non-revenue water” accounts for 30 percent of the total system input globally. Reducing these losses represents a direct opportunity for utility cost recovery.
In the U.S., policy is beginning to reflect these economic realities. By early 2025, at least 18 states had introduced legislation to reform insurance programs and account for rising water-related risks, following models pioneered in Colorado. These legislative efforts acknowledge that historical pricing and risk models are no longer sufficient.
The economic narrative of water is moving to the center of the balance sheet. From semiconductor fabs in Phoenix to agricultural hubs in California, the price of the next gallon is being recalculated. The transition toward managing water as a high-volatility asset is now a fundamental requirement for long-term economic planning.
Sources
- Bluefield Research — National Water and Sewer Bills Rise 5.1%, March 2026
- World Bank — High and Dry: Climate Change, Water and the Economy, May 2016
- IMF — Macro-Criticality of Water Resources (Working Paper 2025), December 2025
- OECD — The Economics of Water Scarcity
- U.S. Bureau of Reclamation — Colorado River Post-2026 Operations, April 2026
- UC Davis — California Risks Billions in Economic Losses, 2024
The information presented is for educational and informational purposes only and does not constitute investment advice. MainStreet uses AI to generate content — always verify with qualified financial professionals before making investment decisions. How MainStreet works →
Discussion