Americans Pay $75 a Month for Internet That South Korea Gets for $30 — Here's Why
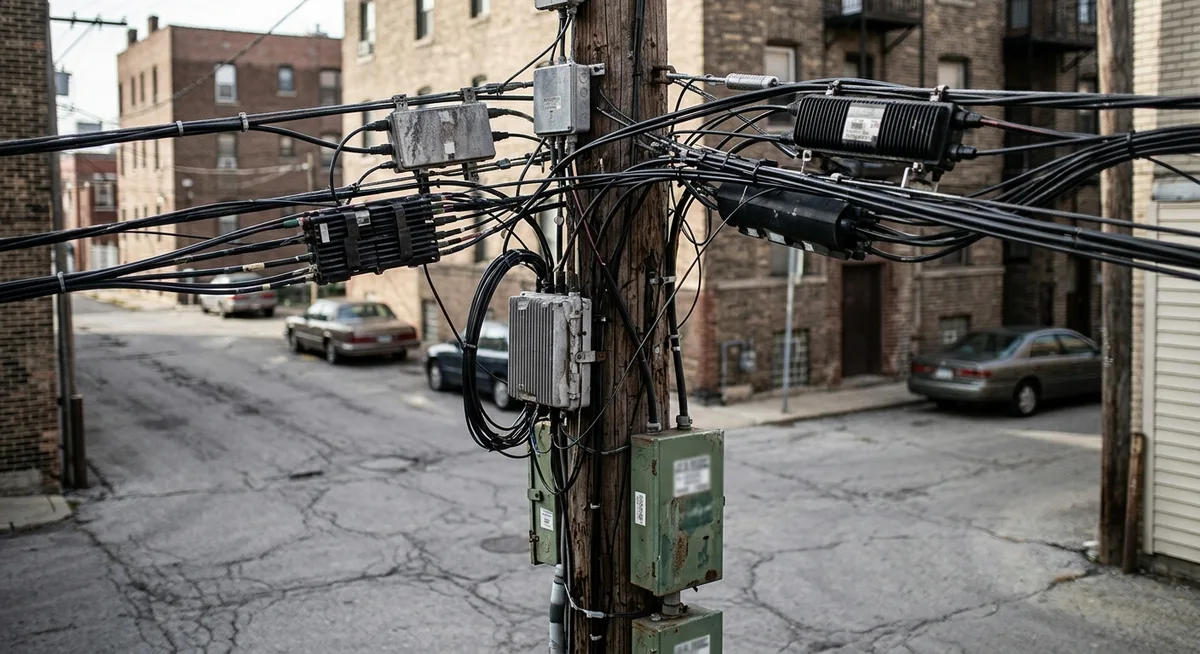
In the upscale Gangnam district of Seoul, a resident can secure a symmetrical gigabit fiber connection for approximately $25 a month. For that price, they receive speeds fast enough to download a feature-length high-definition movie in less than 40 seconds. Meanwhile, 6,500 miles away in Chicago, a family paying triple that amount—roughly $75 a month—often relies on speeds a fraction as fast, provided by a single cable provider that may be the only wired high-speed option in their neighborhood.
It is the result of decades of diverging policy choices, regulatory frameworks, and market structures. As of early 2024, the digital divide between the United States and its global peers remains a defining feature of the American economic landscape, influencing everything from where people choose to live to how their children learn.
While the U.S. was the birthplace of the internet, it has fallen behind in making it a cheap, ubiquitous utility. This is a story of market power and policy, not just the physical challenge of stringing wires across a vast continent.
The Price Gap is Real and Measurable
As of 2023, the average monthly high-speed internet bill in the United States stands at $67.57, according to data from industry researchers. When factoring in equipment rentals and hidden fees, that figure frequently climbs above $75. This ranks the U.S. as one of the most expensive nations for connectivity among developed economies.
In contrast, South Korean consumers benefit from national infrastructure planning initiated in the 1990s, paying an average of $21.31 to $30.00 per month for gigabit fiber connections. The value proposition is even more lopsided when looking at price per Megabit per second (Mbps). U.S. broadband value currently sits at roughly $0.45 per Mbps, significantly higher than France ($0.28), Japan ($0.29), and South Korea ($0.20).
At the extreme end of the efficiency spectrum lies Romania. The Eastern European nation offers some of the world’s cheapest broadband, estimated at just $0.01 per Mbps. This was driven by a history of highly competitive local “basement” networks that eventually scaled up into a sophisticated national grid. While Romania’s geography is smaller than that of the U.S., the fundamental driver was the same as in South Korea: a market structure that encouraged multiple players to fight for every customer.
The U.S. currently ranks outside the top 10 globally in average download speeds. While these speeds are sufficient for basic streaming, the high cost of entry creates a barrier that other nations have successfully dismantled. According to OECD data from 2023, fiber-optic penetration in South Korea has reached 89% of households. The U.S. trails significantly, with estimates sitting at approximately 43% to 45% of households having access to fiber.
The Competition Problem: A Nation of Duopolies
The primary driver of high American prices is a lack of choice. A 2023 analysis of FCC data found that broadband competition is severely limited across most U.S. counties. For millions of Americans, the market isn’t a competitive arena; it’s a localized monopoly or a duopoly between a single cable provider and a legacy telephone company.
According to the Open Technology Institute’s “Cost of Connectivity” report, 77 percent of Americans live in areas where the only option for high-speed, high-capacity wired Internet access is through their local cable monopoly. This lack of competition removes the incentive for providers to lower prices or improve service quality.
In highly concentrated U.S. markets where only one or two providers exist, consumers pay significantly higher rates than those in competitive markets. In the most underserved counties in the U.S., monthly broadband costs can exceed $150 for speeds that would cost less than $50 in competitive urban hubs.
Source: BroadbandNow/OTI
Municipal broadband—networks owned and operated by local governments—has emerged as a potent alternative. Chattanooga, Tennessee, became a prominent example with its city-owned fiber network, which offers gigabit speeds at prices that forced private incumbents to lower their rates to remain competitive.
Expanding this model is difficult. As of 2024, approximately 16 U.S. states maintained laws that either ban or severely restrict municipalities from building their own public broadband networks. These laws are often the result of industry lobbying aimed at preventing government-led competition from entering profitable urban and suburban markets. “We should be doing everything in our power to lower the barrier for cities to invest in their own futures,” Knoxville Mayor Indya Kincannon noted during discussions on municipal expansion, reflecting a growing sentiment among local leaders.
The Infrastructure Question: Geography vs. Density
Laying fiber across the Great Plains or the Appalachian Mountains is undeniably more expensive than doing so in a dense city-state like Singapore or a compact nation like South Korea.
According to 2023 industry reports on fiber deployment, U.S. costs rose significantly due to labor and material inflation. Underground fiber is particularly expensive, often costing several times more per foot than aerial builds attached to existing utility poles.
Yet, density doesn’t fully explain the gap. If geography were the only factor, residents of New York City or San Francisco should enjoy prices comparable to those in Tokyo or Paris. Instead, urban Americans continue to pay significantly more than their international counterparts.
Analysis from the Open Technology Institute found that modem rental fees and other surcharges can add significantly to a monthly bill in the U.S., whereas these costs are often bundled or non-existent in European and Asian markets. These “hidden costs” are a uniquely American phenomenon that obscures the true price of connectivity.
To address the rural coverage gap, the federal government launched the $42.5 billion Broadband Equity, Access, and Deployment (BEAD) program. This initiative represents the largest single investment in U.S. history to close the digital divide. The rollout is currently in the planning and state-allocation phase, and the debate over what technology to use—fiber, cable, fixed wireless, or satellite—remains a point of contention between policymakers and industry leaders.
Economic Impact: The Cost of Disconnection
The price of internet is a prerequisite for economic participation. For remote workers, reliable broadband is as essential as electricity. When it is unavailable or unaffordable, rural communities lose talent and businesses.
Rural U.S. counties with broadband adoption rates over 80% saw significantly higher business growth compared to those with low adoption rates between 2020 and 2022, according to the Center on Rural Innovation. Conversely, small businesses in underserved areas face a competitive disadvantage, unable to leverage cloud computing, e-commerce, or global supply chain tools effectively.
There is also a profound human cost. The “homework gap” remains a persistent issue. The FCC estimates that millions of children are affected by a lack of home broadband. In zip codes where the median household income is below $35,000, the rate of home broadband adoption is nearly 30 percentage points lower than in zip codes where the median income exceeds $75,000.
“The persistent digital divide in the United States is a barrier to the economic competitiveness of the United States and equitable distribution of essential public services, including health care and education.”
Low-income U.S. households pay approximately 2.43% of their monthly income for broadband, which is more than four times the 0.51% share paid by wealthier households, according to data from the Federal Reserve Bank of New York. The expiration of the Affordable Connectivity Program (ACP) in early 2024 has further exacerbated this, putting an estimated 23 million households at risk of losing access or facing increased monthly bills they cannot afford.
The macroeconomic stakes are high. The Fiber Broadband Association suggests that moving all U.S. home users to gigabit fiber could add hundreds of billions of dollars to the U.S. GDP by increasing remote work productivity and fostering new digital industries.
Global Models That Work: Lessons in ‘Open Access’
South Korea’s success was the result of a deliberate, decade-long national strategy. Between 1995 and 2005, the South Korean government invested tens of billions in the ‘Korea Information Infrastructure’ program. They treated broadband not as a luxury or a private service, but as a public utility essential for national survival in the information age.
South Korea implemented ‘Open Access’ or ’line sharing’ rules. These regulations require companies that own the physical infrastructure—the wires in the ground—to lease those lines to competitors at fair, regulated rates. This means a single fiber line entering an apartment building can be used by multiple different ISPs, all competing on price and customer service.
In the U.S., the model is usually ’exclusive entry.’ If a cable company or a fiber provider wires a building, they often have a de facto monopoly on that building. Competitors would have to dig their own trenches and run their own lines to compete, a capital-intensive prospect that discourages new entrants.
Source: OECD Broadband Portal
Other models offer different lessons. Sweden uses a similar open-access model where municipalities often own the physical fiber and let private companies compete to provide the actual internet service. Australia attempted a massive National Broadband Network (NBN) to reach its sparsely populated interior. While the NBN rollout faced political shifts and cost adjustments, it eventually established a baseline of connectivity that the private market would have likely ignored.
Estonia has built its entire government infrastructure—from voting to tax filing—on the assumption of universal, high-speed access. By making the internet a fundamental right, they forced the infrastructure to follow the policy, rather than letting the market dictate who gets connected.
What’s Changing: 5G, Satellites, and Federal Billions
There are signs that the American broadband landscape is shifting. The most significant recent change has come from the air.
5G fixed wireless—where a home uses a high-speed cellular signal rather than a physical wire—has emerged as a competitor to cable. In many suburban areas, T-Mobile and Verizon are now offering home internet that competes directly with Comcast or Charter, often at lower price points and without the same history of hidden fees.
For the most remote areas, Starlink and other Low Earth Orbit (LEO) satellite constellations have altered the equation. Before these services, rural Americans were often stuck with sluggish DSL or high-latency traditional satellite internet. While Starlink remains expensive, it provides a level of speed previously unavailable in the “digital deserts” of the rural West.
The industry argues that the situation is improving. According to USTelecom’s 2023 Broadband Pricing Index, real prices for the most popular broadband tiers dropped when adjusted for inflation. The report notes that consumer broadband services are delivering faster speeds while bills, when adjusted for the broader economy’s inflation, have seen a relative decline.
However, the gap remains wide. The BEAD program’s $42.5 billion is currently being distributed to states, but the process is challenged by the accuracy of the FCC’s broadband maps. These maps, which dictate where the money goes, have been criticized for overstating coverage in rural areas. Many states are currently in the middle of “challenge processes” to correct these maps before the money is locked in.
The urgency of these corrections cannot be overstated. With the expiration of the Affordable Connectivity Program in 2024, millions of low-income families are seeing their monthly bills jump by $30 or more. As states finalize their plans for the BEAD funds, the window to ensure this multi-billion dollar investment actually reaches the unserved—rather than just reinforcing existing provider footprints—is rapidly closing. The true cost of the American digital divide is no longer just a high monthly bill; it is the risk of a permanent economic underclass in an increasingly connected world.
Sources
- Today Testing — Analysis: Internet Speed vs Cost by Country, 2026
- CircleID — Lack of Broadband Competition Leads to Higher Prices in Most U.S. Counties, 2025
- Fiber Broadband Association — Documenting The Economic Benefits of Fiber in 2024, 2024
- New America — The Cost of Connectivity 2020, 2020
- USTelecom — 2025 Broadband Pricing Index, 2025
- Harvard Law School — Susan Crawford on the Telecom Industry and Monopoly Power
- OECD — Broadband Portal 2025 Statistics, 2025
The information presented is for educational and informational purposes only and does not constitute investment advice. MainStreet uses AI to generate content — always verify with qualified financial professionals before making investment decisions. How MainStreet works →
Discussion